Cartography—map design—is our specialty. Whether you require mapping for a disaster, vegetation, watersheds, pre-fire planning or a special personal project, we have you covered. Below is an extensive list of cartography projects we have built for government agencies, non-profits, private companies, city and municipalities, and individuals. If you can see it, we can map it. Contact us for a quote.
Cartography in Our Backyard
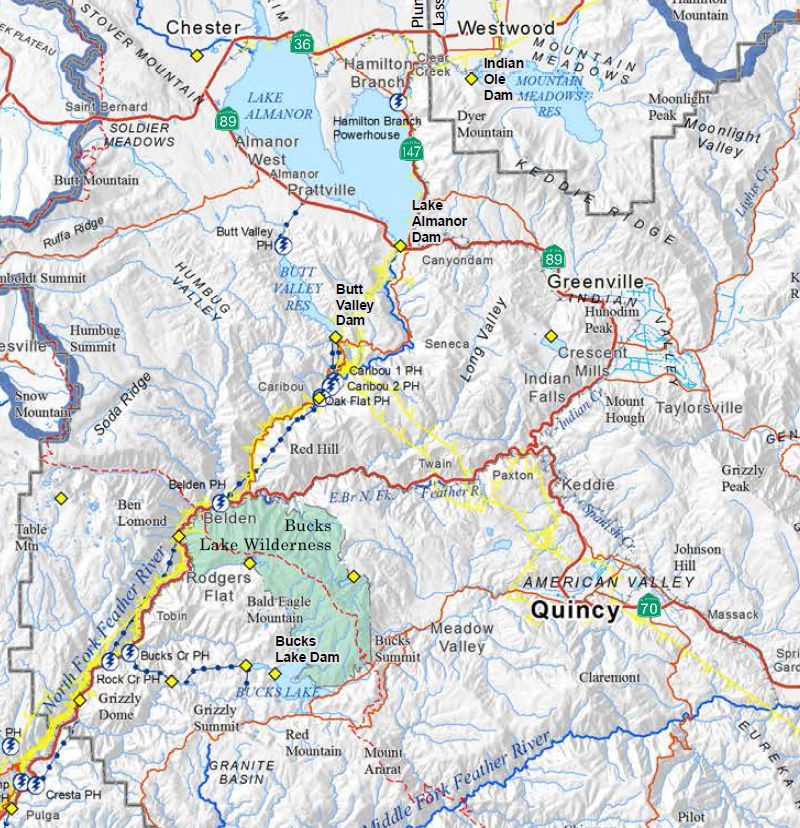
In 2016, we developed a series of thematic maps for the Upper Feather River Integrated Regional Water Management Plan (UFR-IRWM). This was a satisfying project, as we get to use maps to describe an area that we know well.
Old School Cartography
Several of us learned cartography when ink pens and sticky-back labels were the main tools of the trade. Modern digital cartography tools are great for mass-production, but it is tough to create anything digital that has an heirloom feeling to it, so we love it when we get a chance to mash up the old and new schools of cartography, using paint brushes and ink along with our digital layout tools.
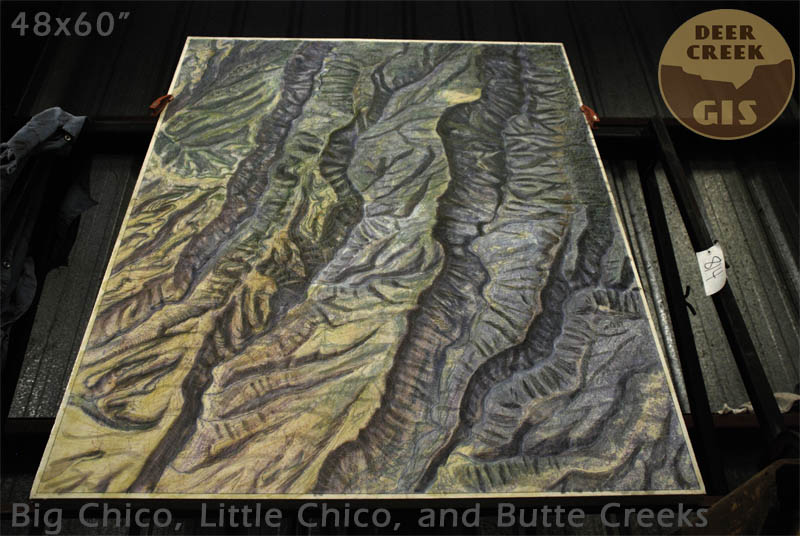
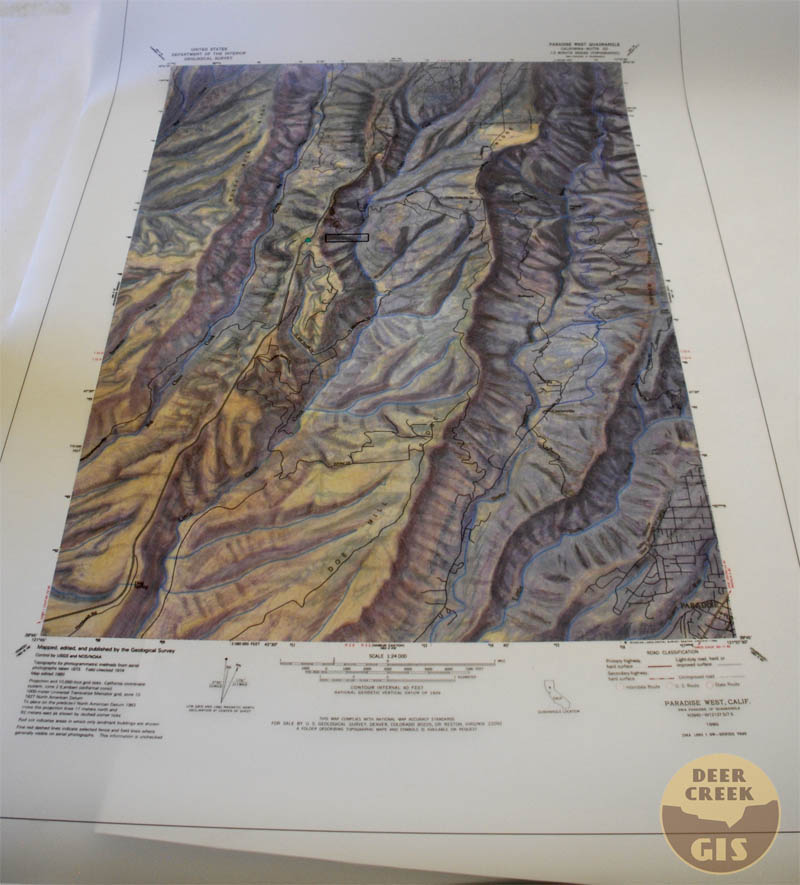
Here is a birthday map that we built a few years ago for a guy that lives up in the foothills above Chico. His kids wanted us to make him a map that showed his property. This project tapped into every drop of creative and technical know-how that we had.
A Dirty, Ragged Map
We got a call back in 2004 from John Maclean, author of many books on firefighting accidents, and son of the late, great Norman Maclean. John was writing a book about wildland firefighting accident in Washington that killed four firefighters and had heard that we did fire-related mapping work. He sent us a manuscript for his new book and we spent several weeks developing illustrations for the story.
This was a challenging assignment. For a wildland firefighter, reading his book is a lot like going through a recurring nightmare. Through a long series of bad calls and miscommunications, you are trapped in a box canyon with a fire burning upstream toward you and no way out. Artistically, we didn’t know how to treat the terrain or the assignment. We have a hard time feeling good about making a map of a place we’ve never been, and in this case we knew that there would be plenty of eyeballs on this map that had been there on the day that things went down. It was early spring, and the site was under six feet of snow, so we never got a chance to see the terrain in person before the maps were due.
We spent a lot of time talking with Lonnie Williams, who had been on the fire, had flown it as an aerial observer for days after the tragedy, and who knew many of the players in the story. He had been to the site after the accident, and had walked from the site of the fire ignition up the canyon to the site of the fatalities while the fire was still burning. Lonnie described a steep, rocky, hot, and underestimated landscape that rained hell on those who didn’t recognize just how dry the slopes above them were as they fought fire in the shade near a river.
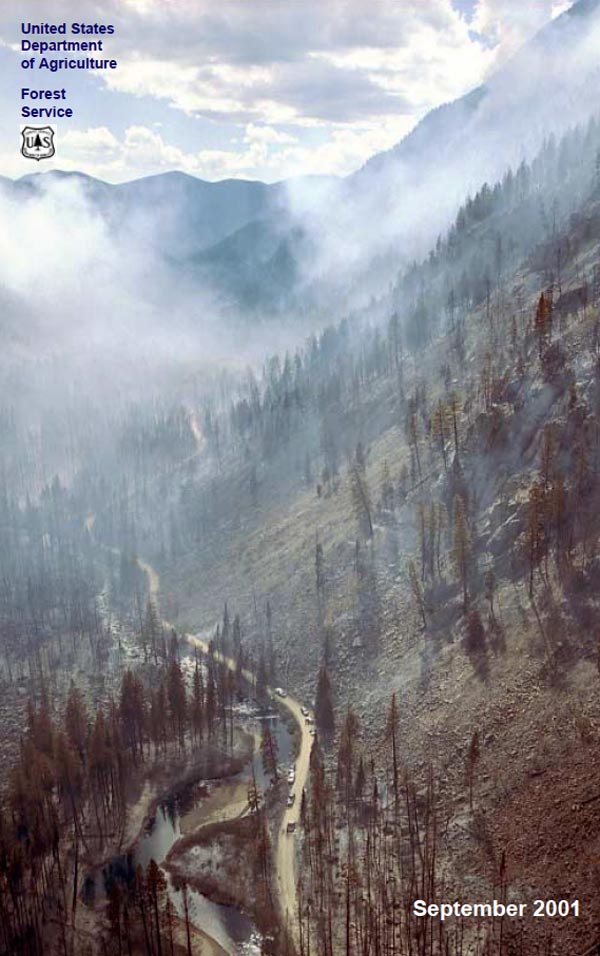
Zeke spent a lot of time trying to track down the information for the maps. There were still unresolved lawsuits going on four years after the accident and nobody at the Forest Service wanted to talk about the story or share information. The District Ranger for the area told us, “I don’t talk to anybody about Thirtymile,” and hung up the phone. We filed a Freedom of Information Act request, but even once this was in action, it was hard to track down any usable information. Zeke ended up using some low resolution maps from the official investigation document as my sources, and also information from John Maclean’s interviews. In the end, we got a member of the investigation to sign off on my final map, but still felt uneasy about making a map of a place we’d never been to.
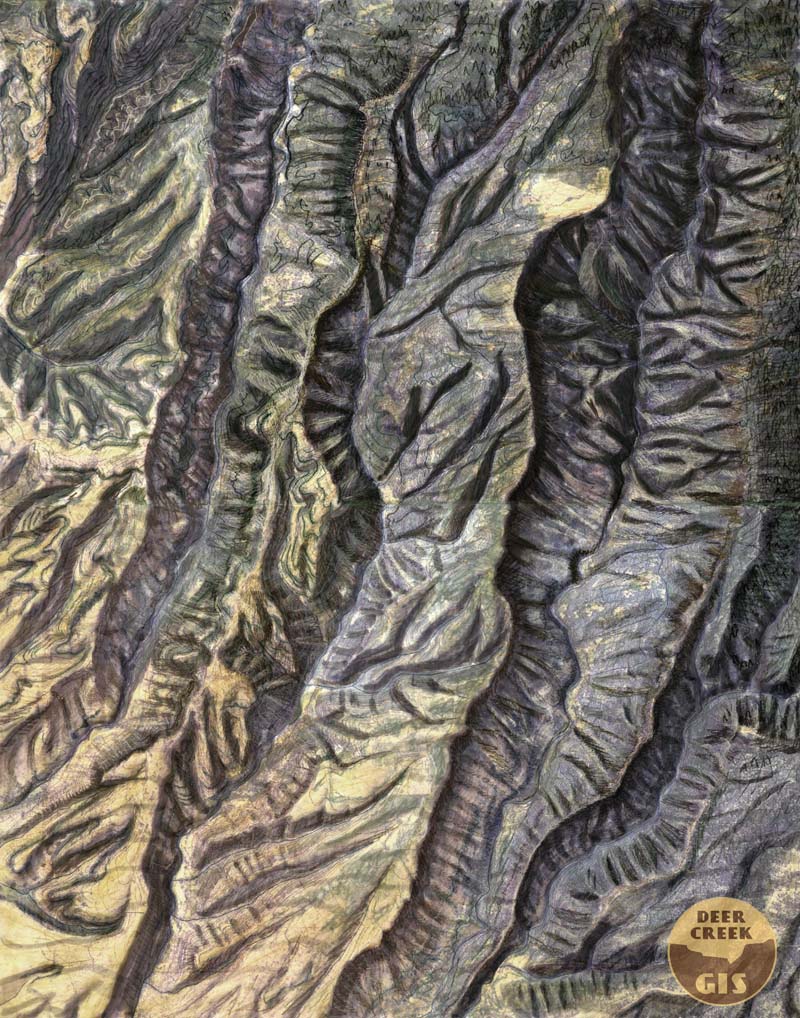
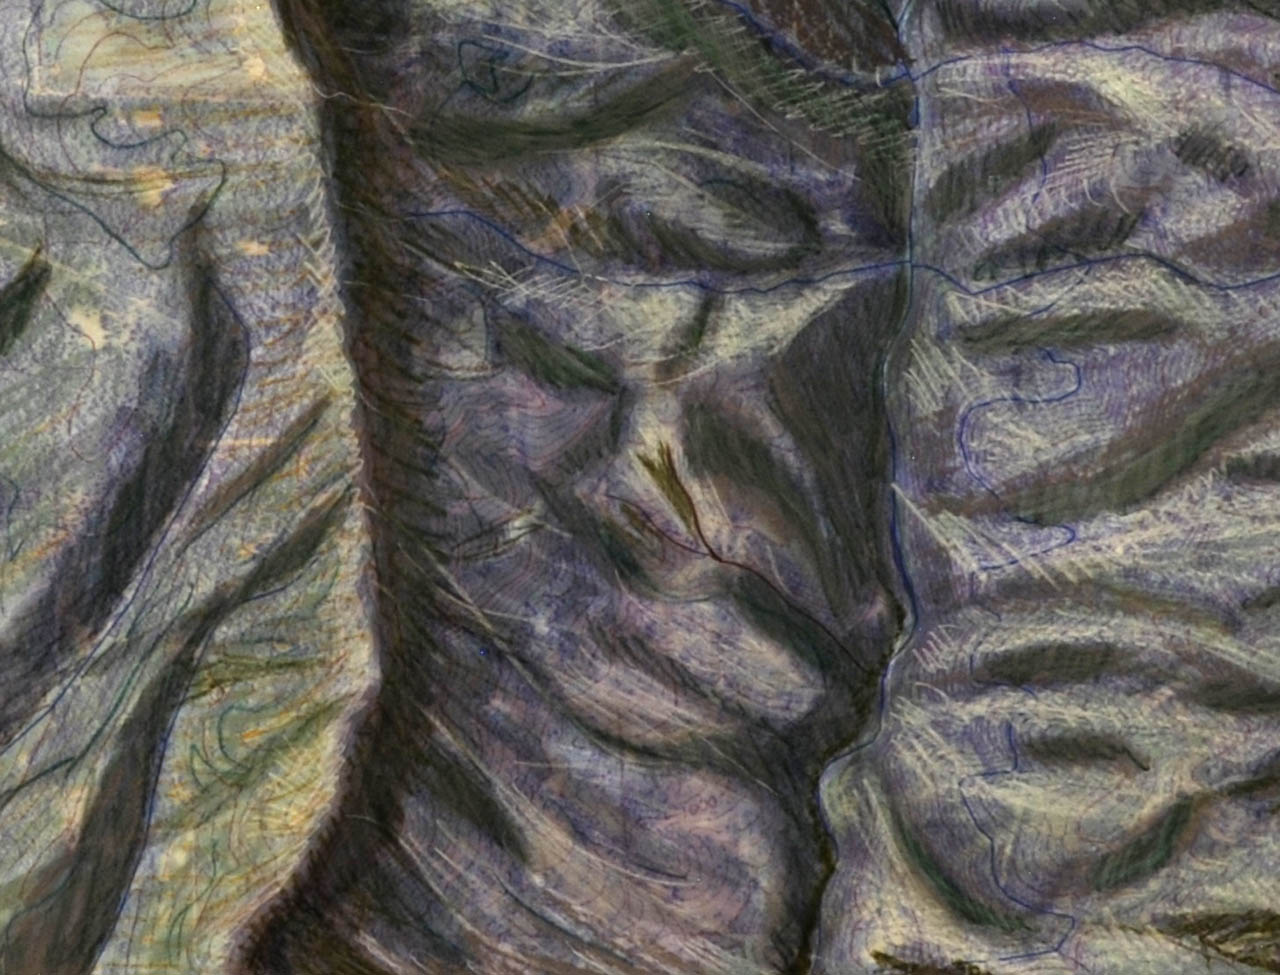
Zeke finally decided that either needed the map to be emotionally neutral, with no terrain, just a plain white background, or it needed to have a LOT of emotion, energy, angst, and raw edges.
Waiting for the wheels to turn in Washington, Zeke had some time to think about the design and try different materials. He spent a lot of time looking at aerial photos and rough sketched the terrain several times before realizing that the map needed a sketch quality, and a wildly scribbled draft became the final. It felt like armchair quarterbacking – not seeing the site, but in the end, we felt like the map captured the quiet raggedness of the place and the people that got run over by a runaway wildfire.
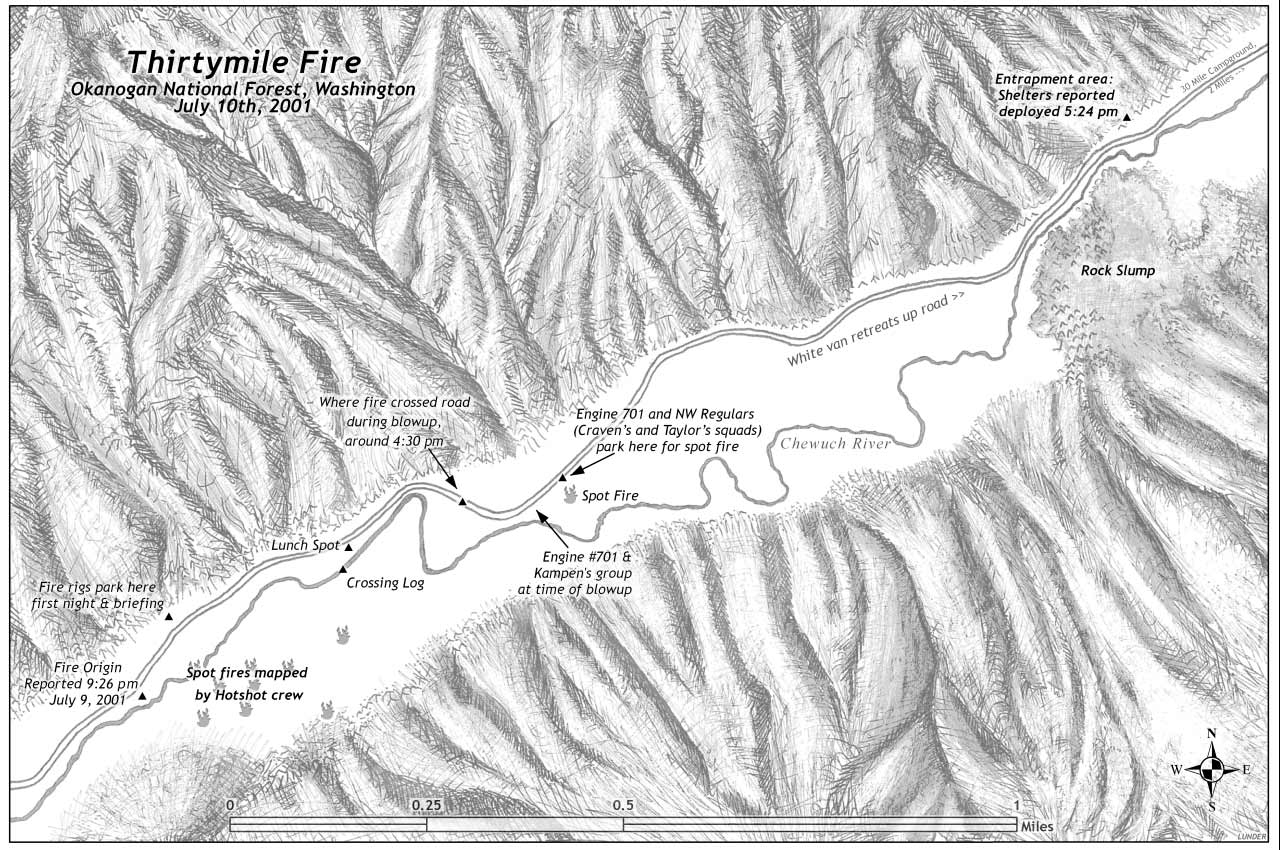
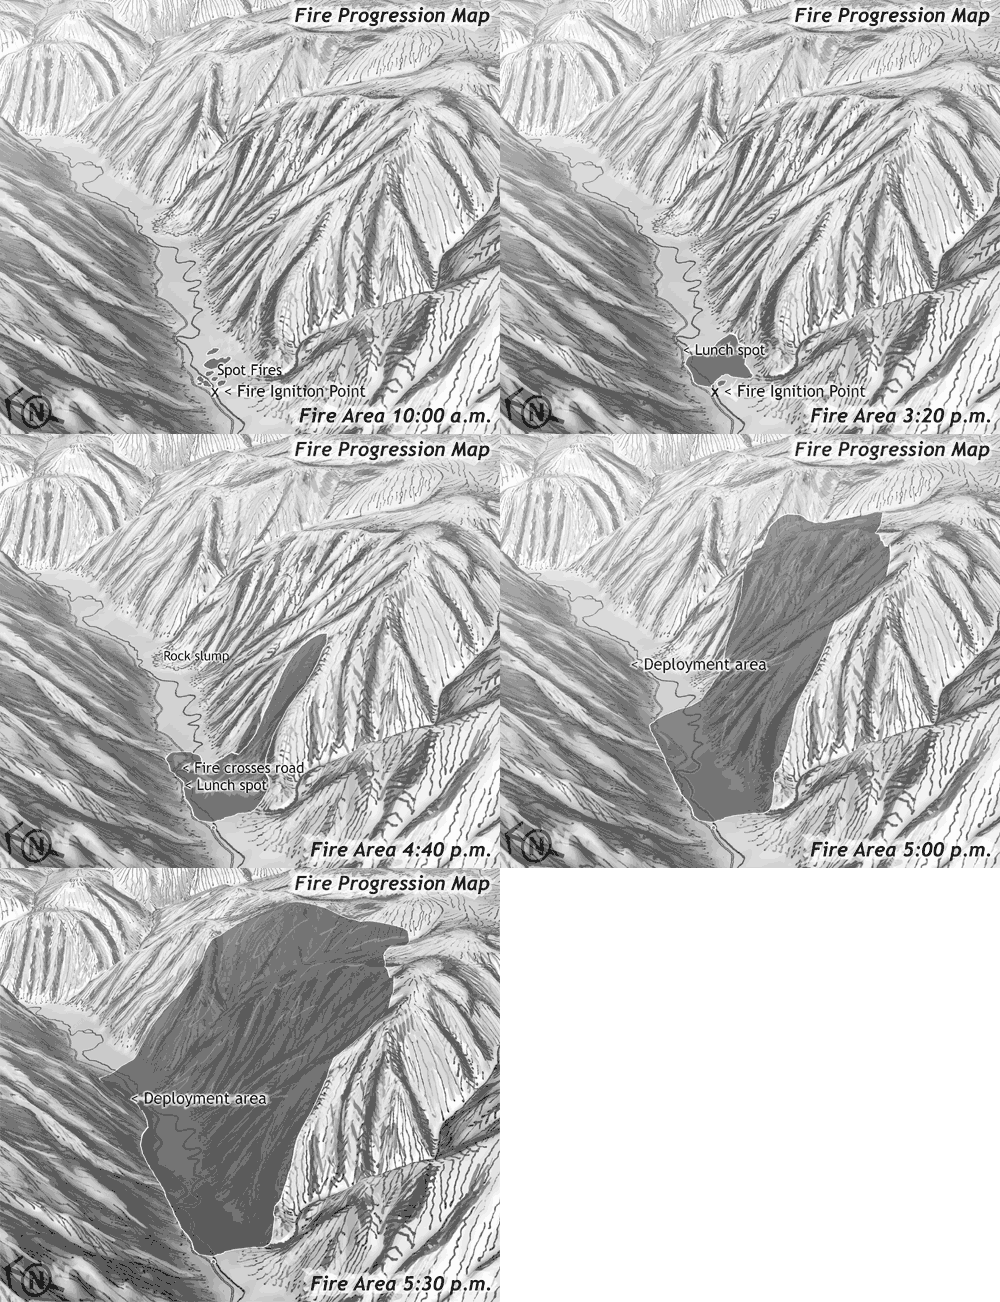
Postscript: A year after making the map, Zeke was on a fire in Eastern Oregon watching a hotshot crew burn out a grass and timbered slope across the creek from the highway. Their lookout was watching from the same turnout from me, and Zeke noticed that he was from the Entiat Hotshots, a local crew that had been on the fire the day that it blew up. Zeke had a chance to show him a dirty ragged copy of the map. Here were some of those eyeballs that had seen it go down—quietly, “Yeah, that’s about how it happened.”
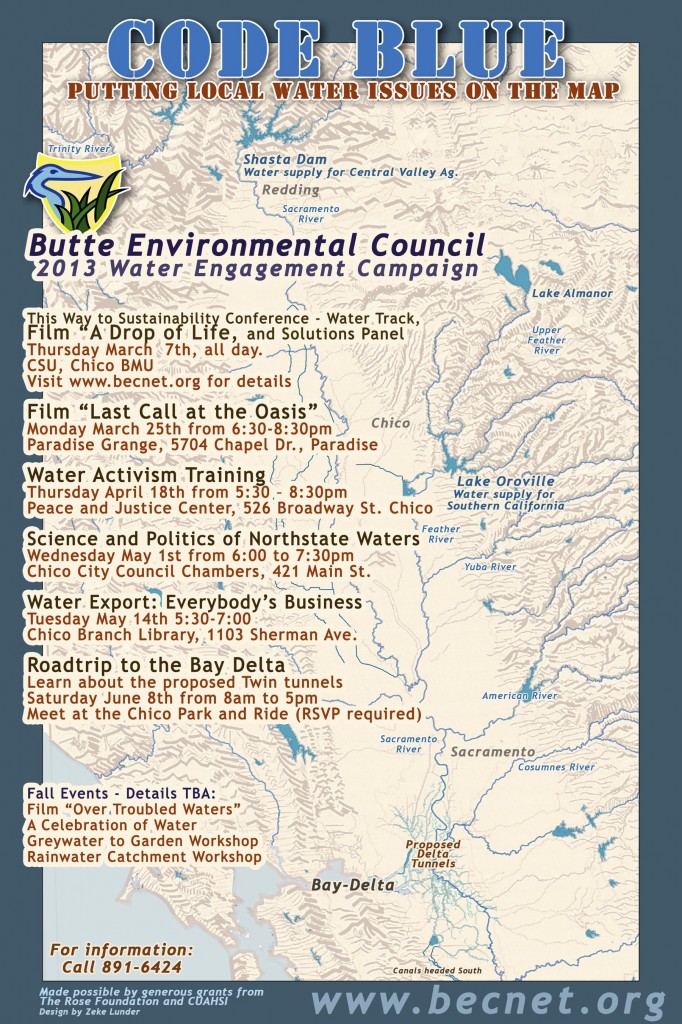
Water Education Poster
This poster was designed for the Butte Environmental Council. The background graphic is from a hand-drawn map that we created with Sharpie at 36″ x 48″.
Satellite Image Analysis
We have been using satellite imagery and remote sensing for the last 15 years on a wide-variety of mapping projects, and are interested in collaborating on efforts that use mapping to improve the efficiency and effectiveness of local water use and management. Here are some example images that we have built recently using multispectral LANDSAT imagery.
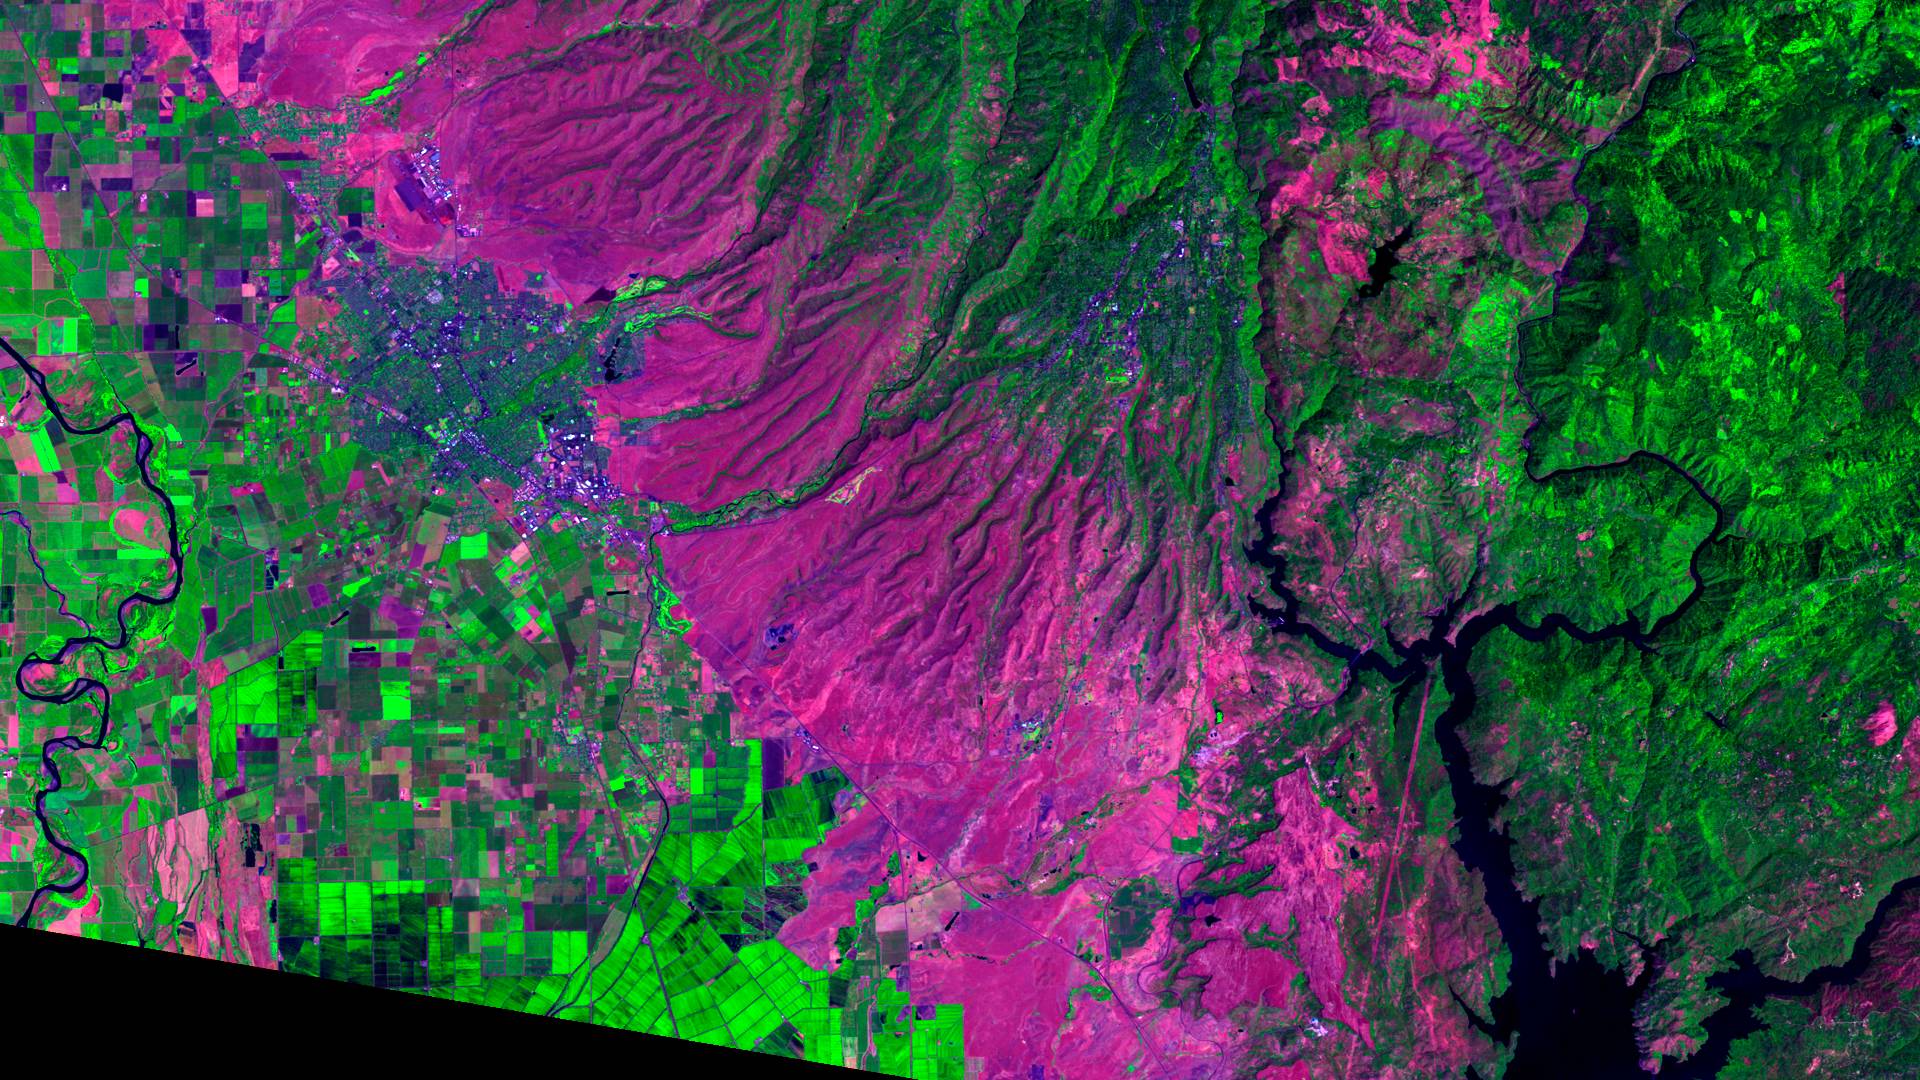
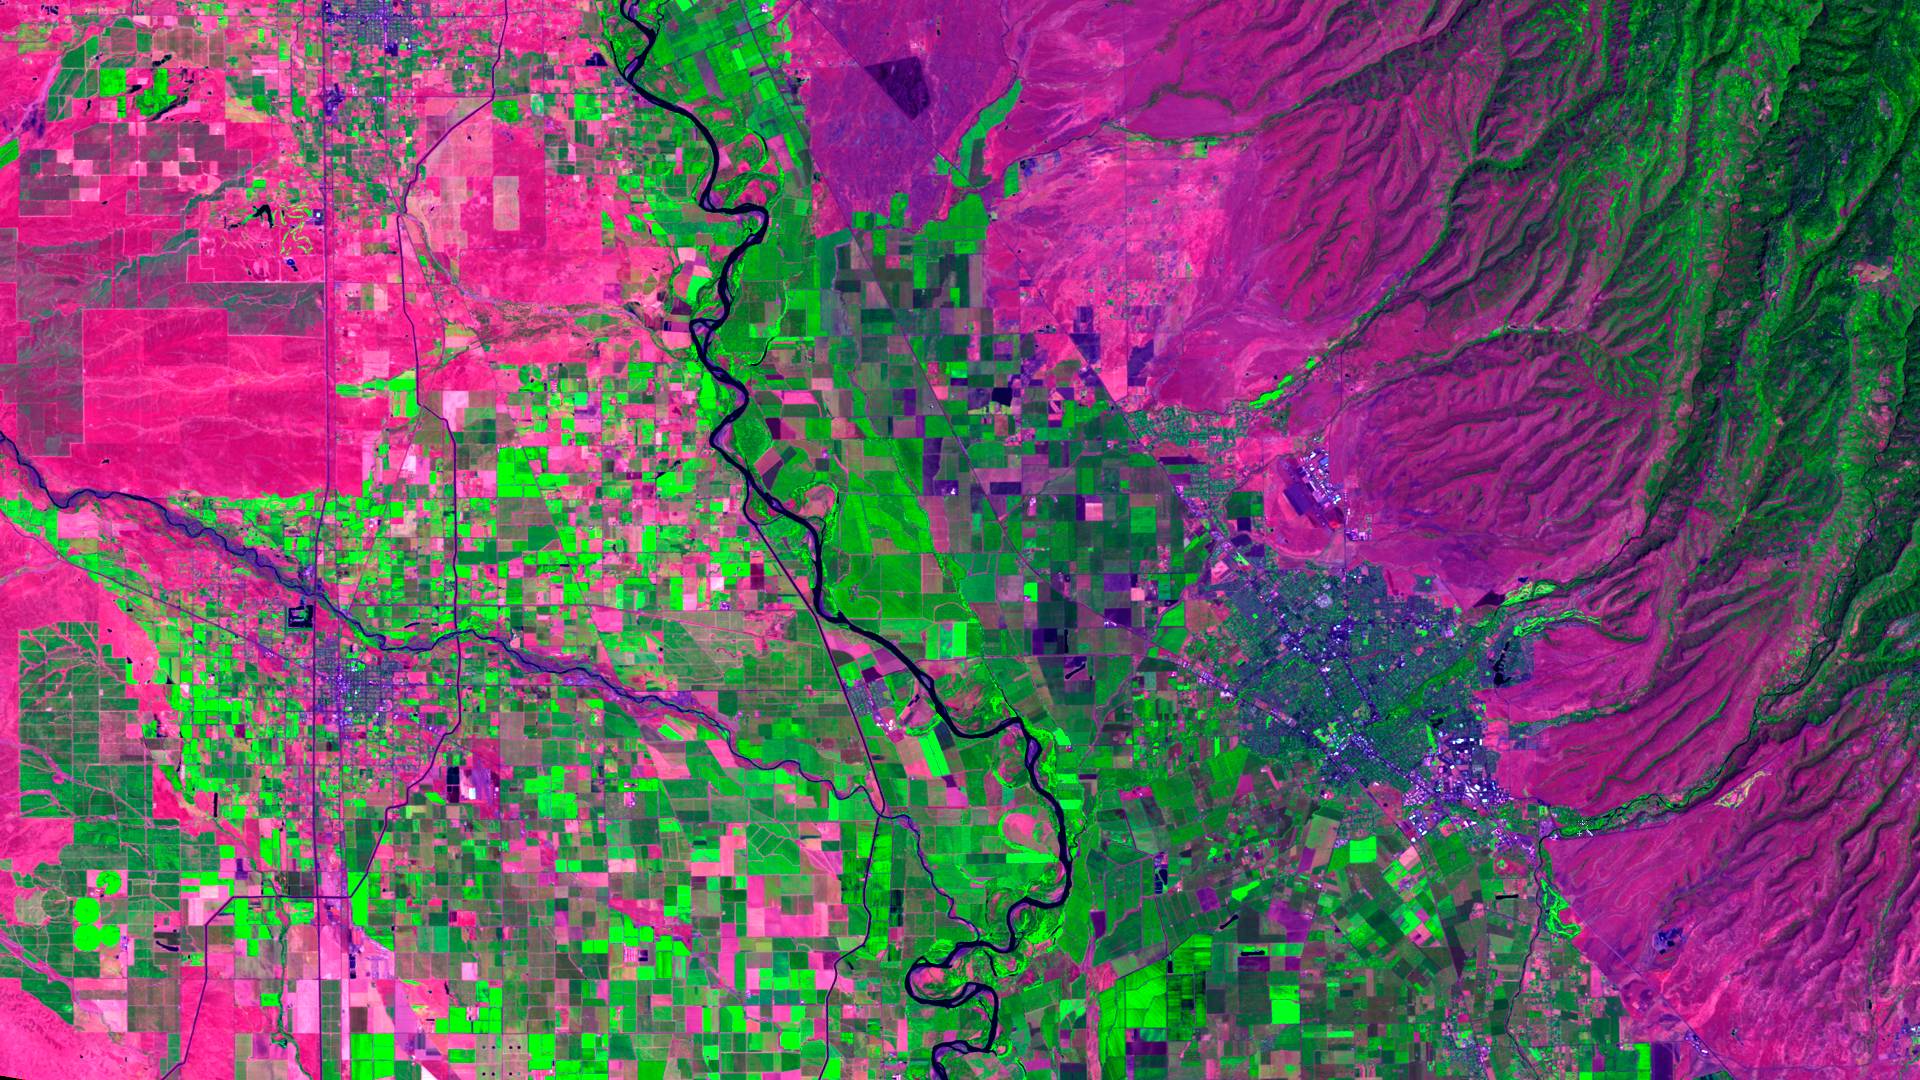
- Purples and pinks are hot in this image. Dark greens are orchards, and bright greens are field crops and alfalfa.
- Rice shows up as dark green where it is still flooded, and as bright green where the fields are being dried out for harvest.
- Basically anything that is irrigated is shades of green, pink fields are either grazing land, fallow fields, or dry wheat.
There are some interesting details in the imagery. For example, on center left, you can see how hot the gravel bars are in the stream corridor of Stony Creek, or the tarmac is at the Chico Airport. Bidwell Park shows up as a cool island among the hot streets of Chico, and you can see just how scorching Southeast Chico is with all of the parking lots and no large trees. Also, the Cohasset, Mangrove, and Nord Ave corridors in Chico show up as very hot in this August 2011 image.
We are interested in developing new applications for this technology. Some of the ideas that we are interested in pursuing include using these broad-scale tools to look into optimizing water temperatures in rice fields, and more accurately inventorying water and land use across multiple jurisdictions.
Historic Vegetation of Whiskeytown
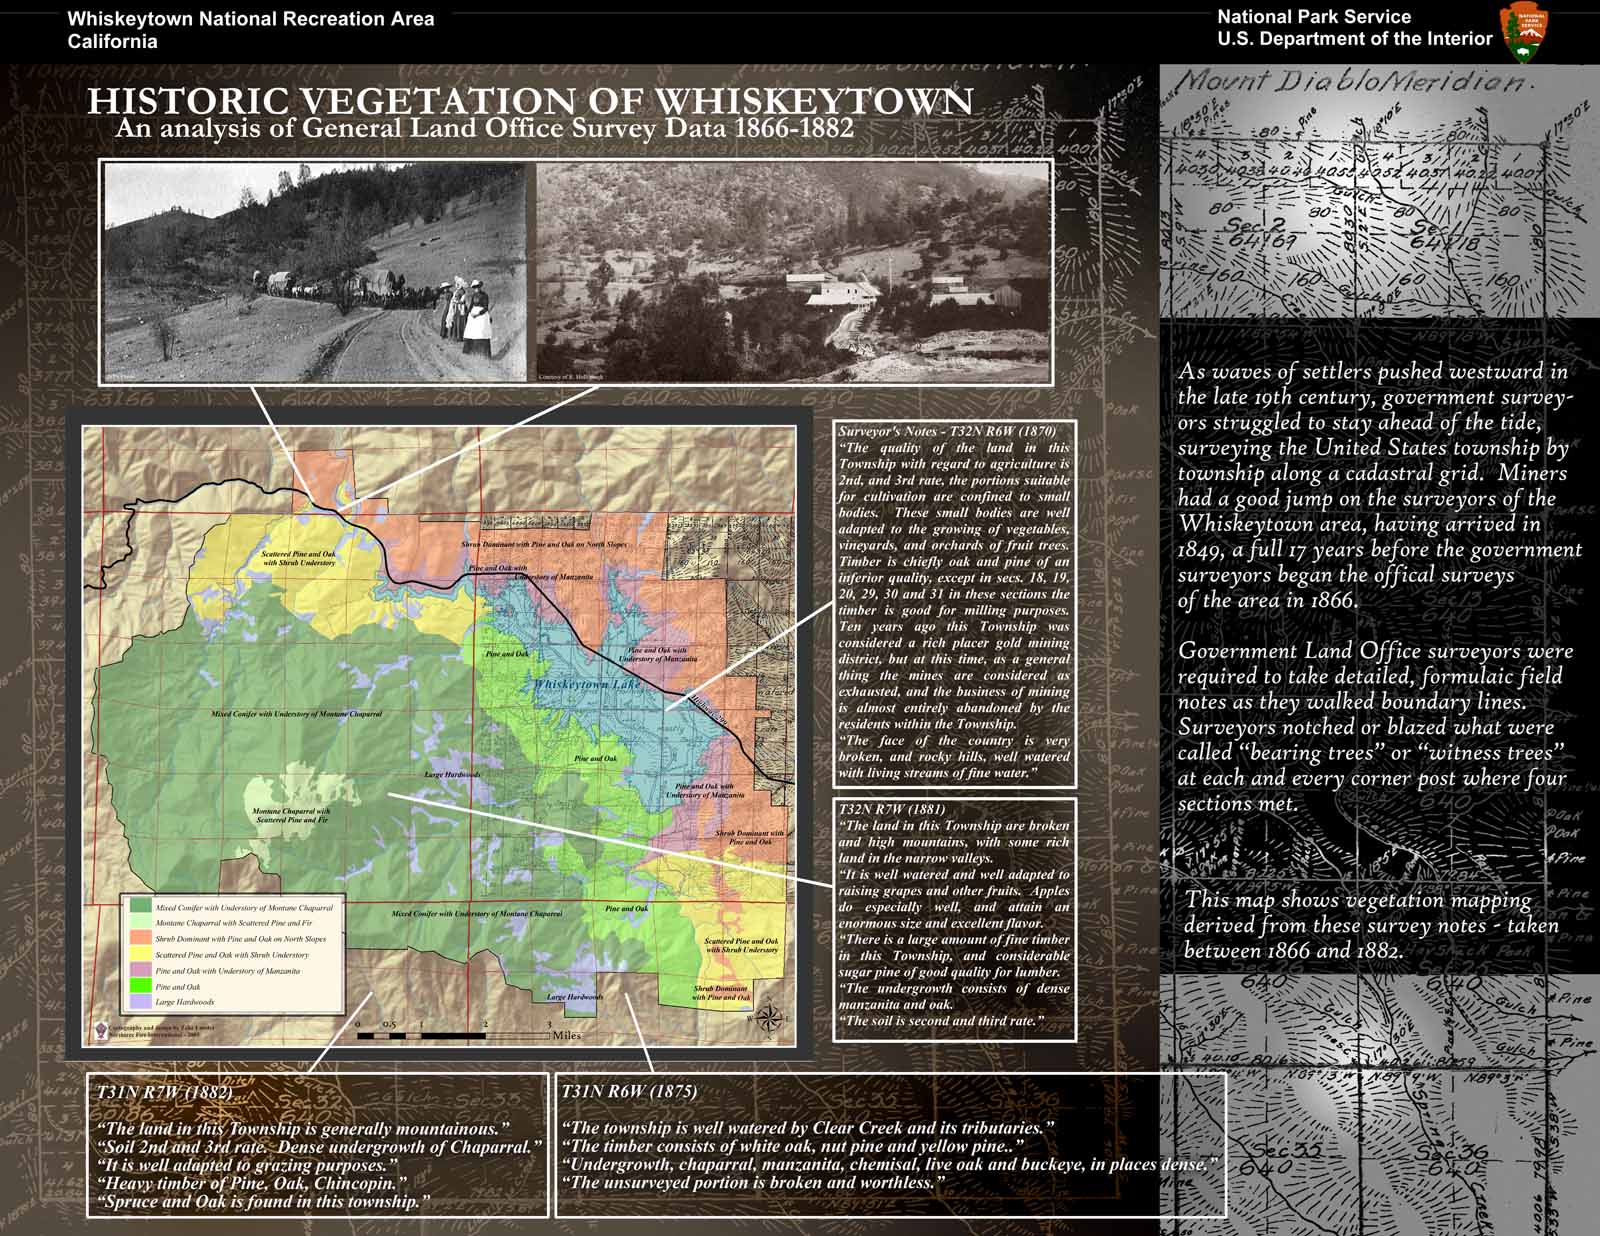
Here is a project that Zeke did for Whiskeytown National Recreation area a few years ago. The National Park Service wanted to create a display for their visitor center that showed what the vegetation had been like in the area when settlers first arrived. They provided mapping data from vegetation surveys taken in the 1950s and later, along with maps and survey observations taken by the original Federal land surveyors in the late 1800s. This data was analyzed to associate the specific types of trees observed in the first surveys with current soil and elevation maps, and the resulting data was used in a predictive modeling exercise that created mapping of potential historic vegetation patterns.
The final poster design used scans of the historic maps and photos along with modern elevation models and digital design. Research and writing to support this project by Kirsten Bovee. Here is the resulting poster display.
Westwood Millpond Historic Aerial Photo
We did a quick project for our friends at Mountain Meadows Conservancy. They are working on a project to see what can be done to clean up the old millsite in Westwood, and part of that effort is looking at the exact layout of the historic sawmill vs. the current condition. They found an aerial photo from 1941, and Kirsten Bovee did some research to label the different buildings and infrastructure on the old photo. She sent us her labels, and then we designed a poster/map that shows that image with current property boundaries on top of it, along with a current aerial photo of the same site.
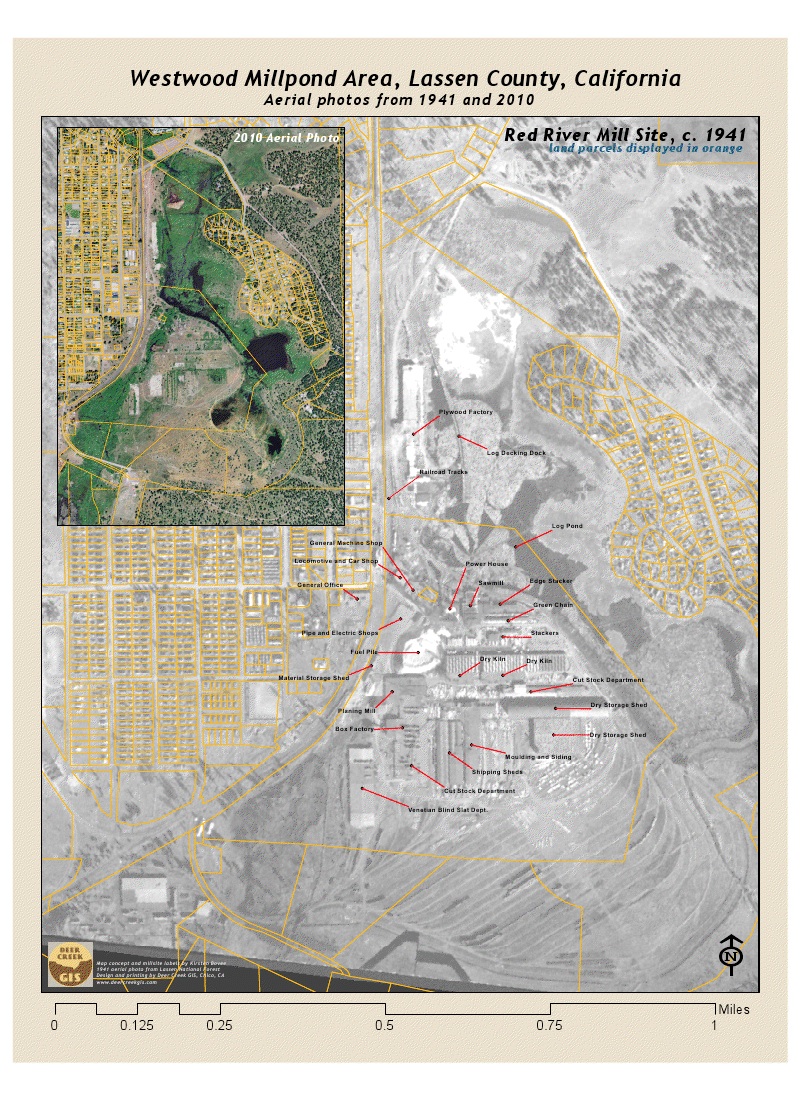
It’s remarkable how little has changed on the site in the last 50 years. All of the old foundations are still plainly visible, and the berm that held back the millpond stands out clearly on the 2010 image. I never had realized that the berm was also the main rail spur for trains dropping logs into the pond.
Download a full sized graphic of this poster image here. 30″x40″ prints of this poster are available on glossy photo paper or canvas for $50 – email us.
Lassen Range Illustration
Here is an illustration project that Zeke did a few years ago for some friends that like to ski in Lassen Volcanic National Park, near our in Chico, California. Zeke grew up skiing in Lassen when there was still a rope tow and poma lift (later a chairlift), and we spent a lot of time hiking, climbing and exploring in the park. This is the perspective of Lassen and Brokeoff Mountain as seen from the east, the same view we came to know as kids growing up in Lassen County.
This illustration began as a Google Earth screenshot printed about five feet long on a plotter. Zeke worked over the image with India ink on a brush, and used black and white china markers to deepen shadows and add highlights.
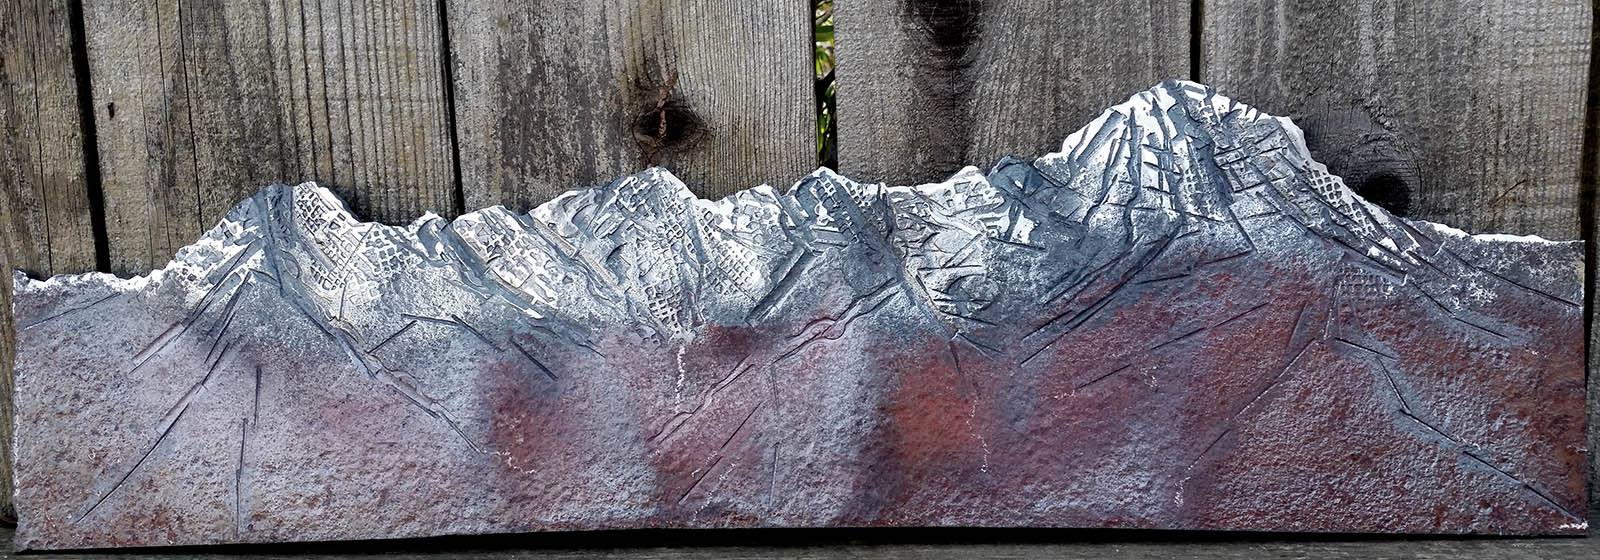
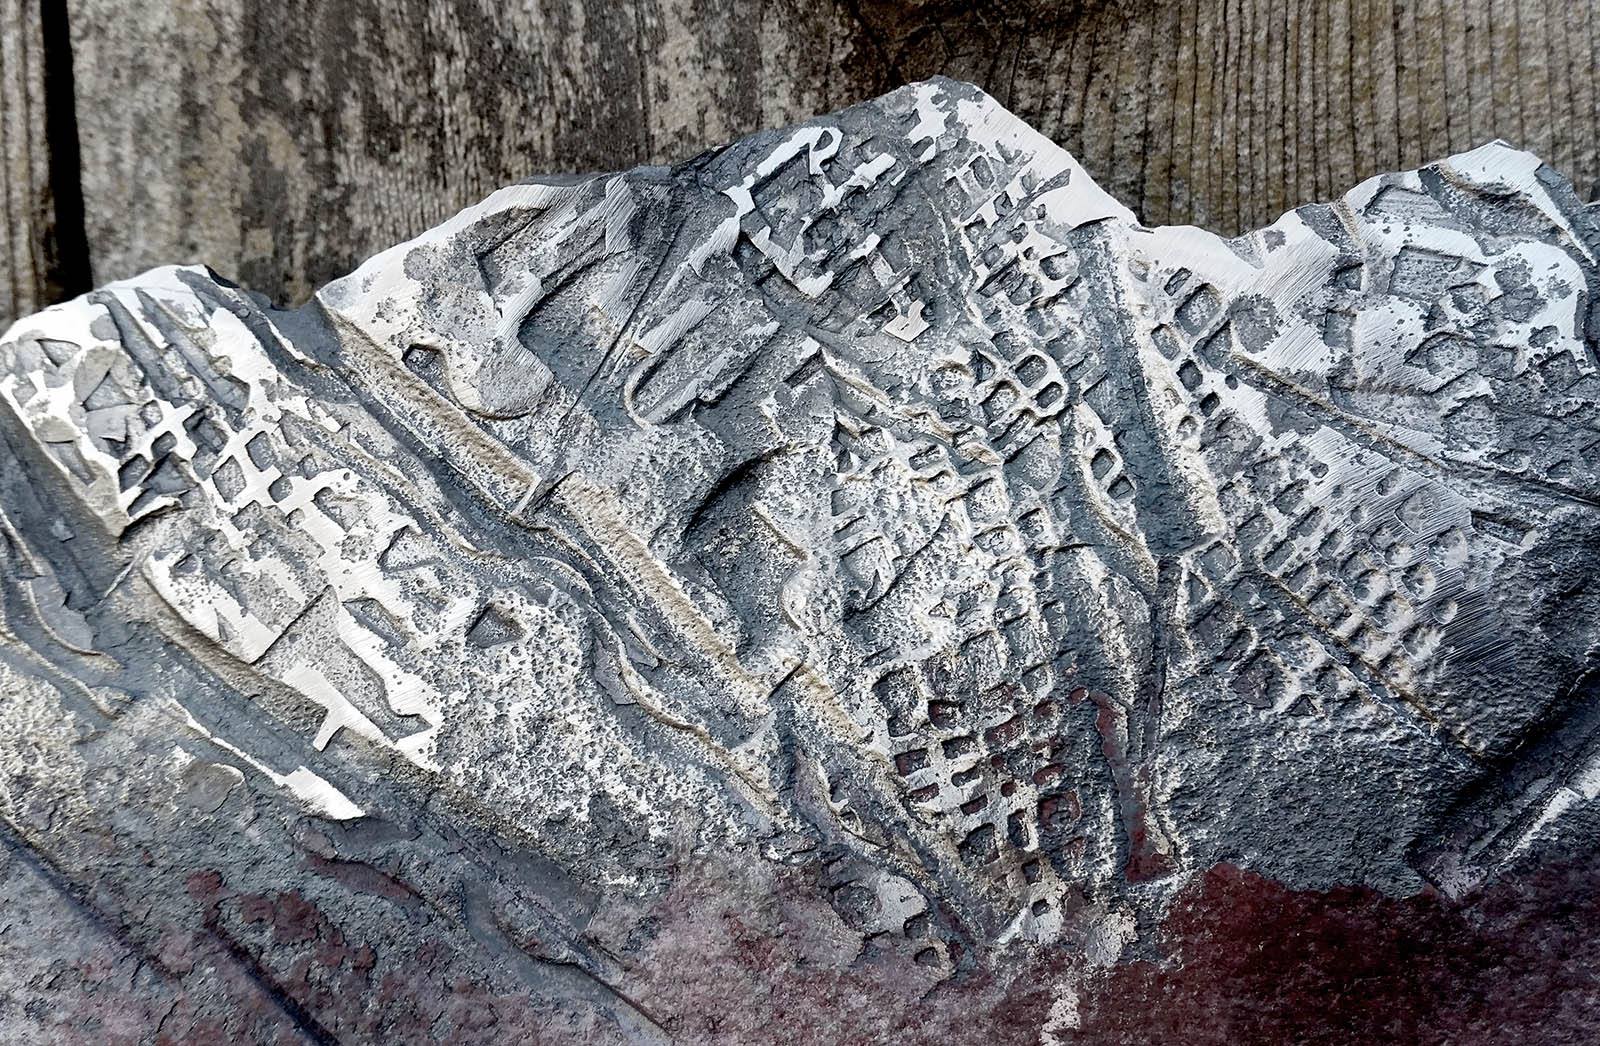
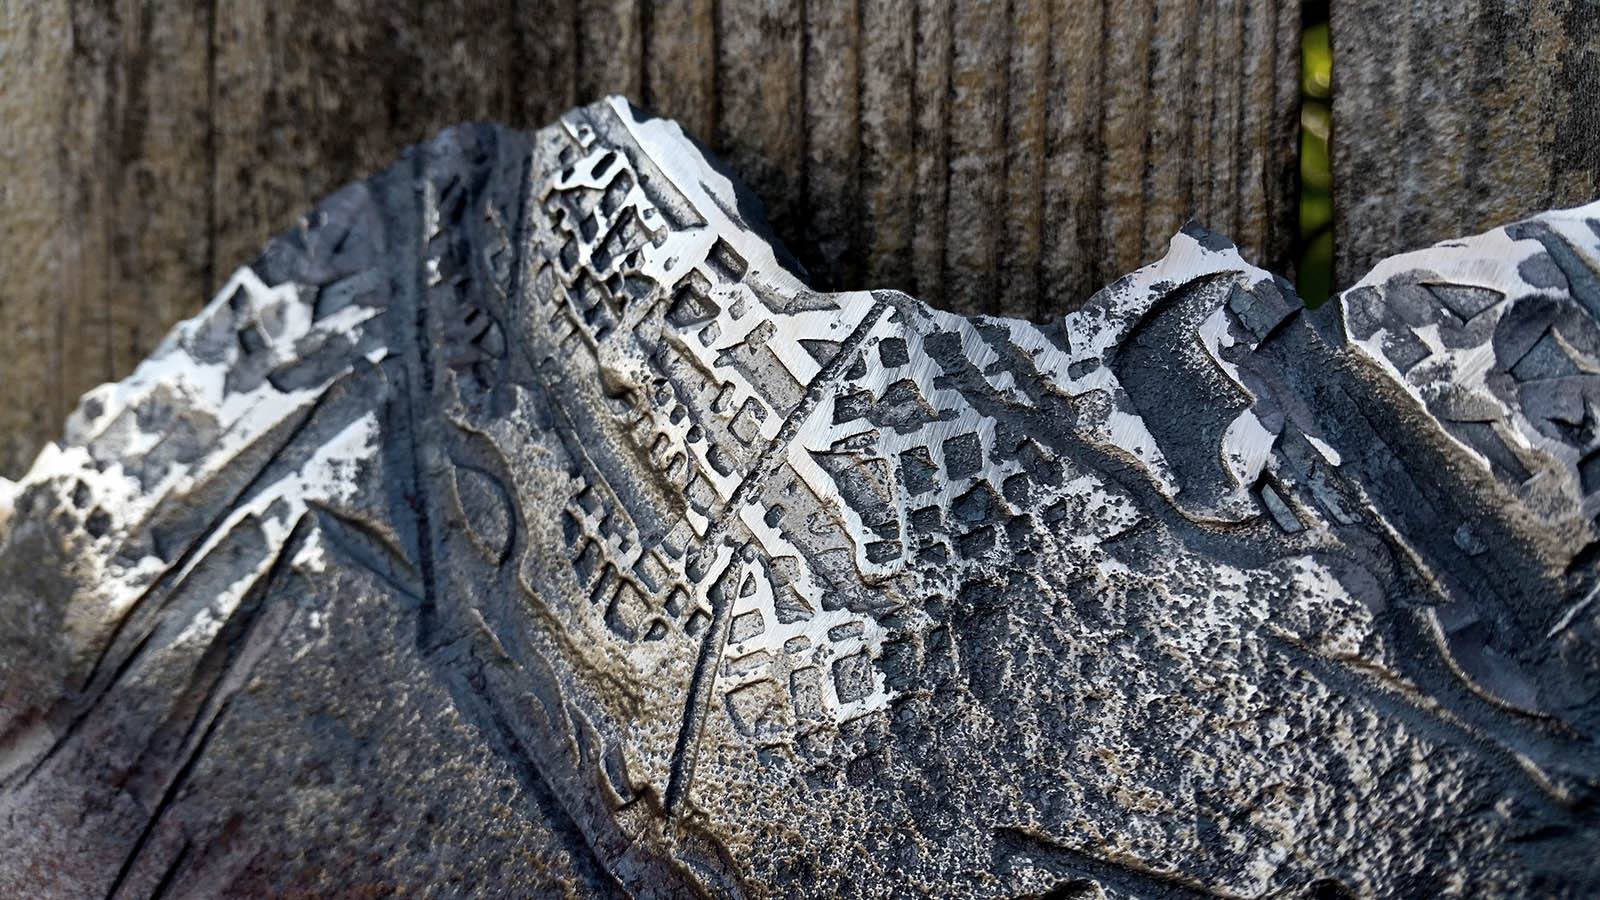
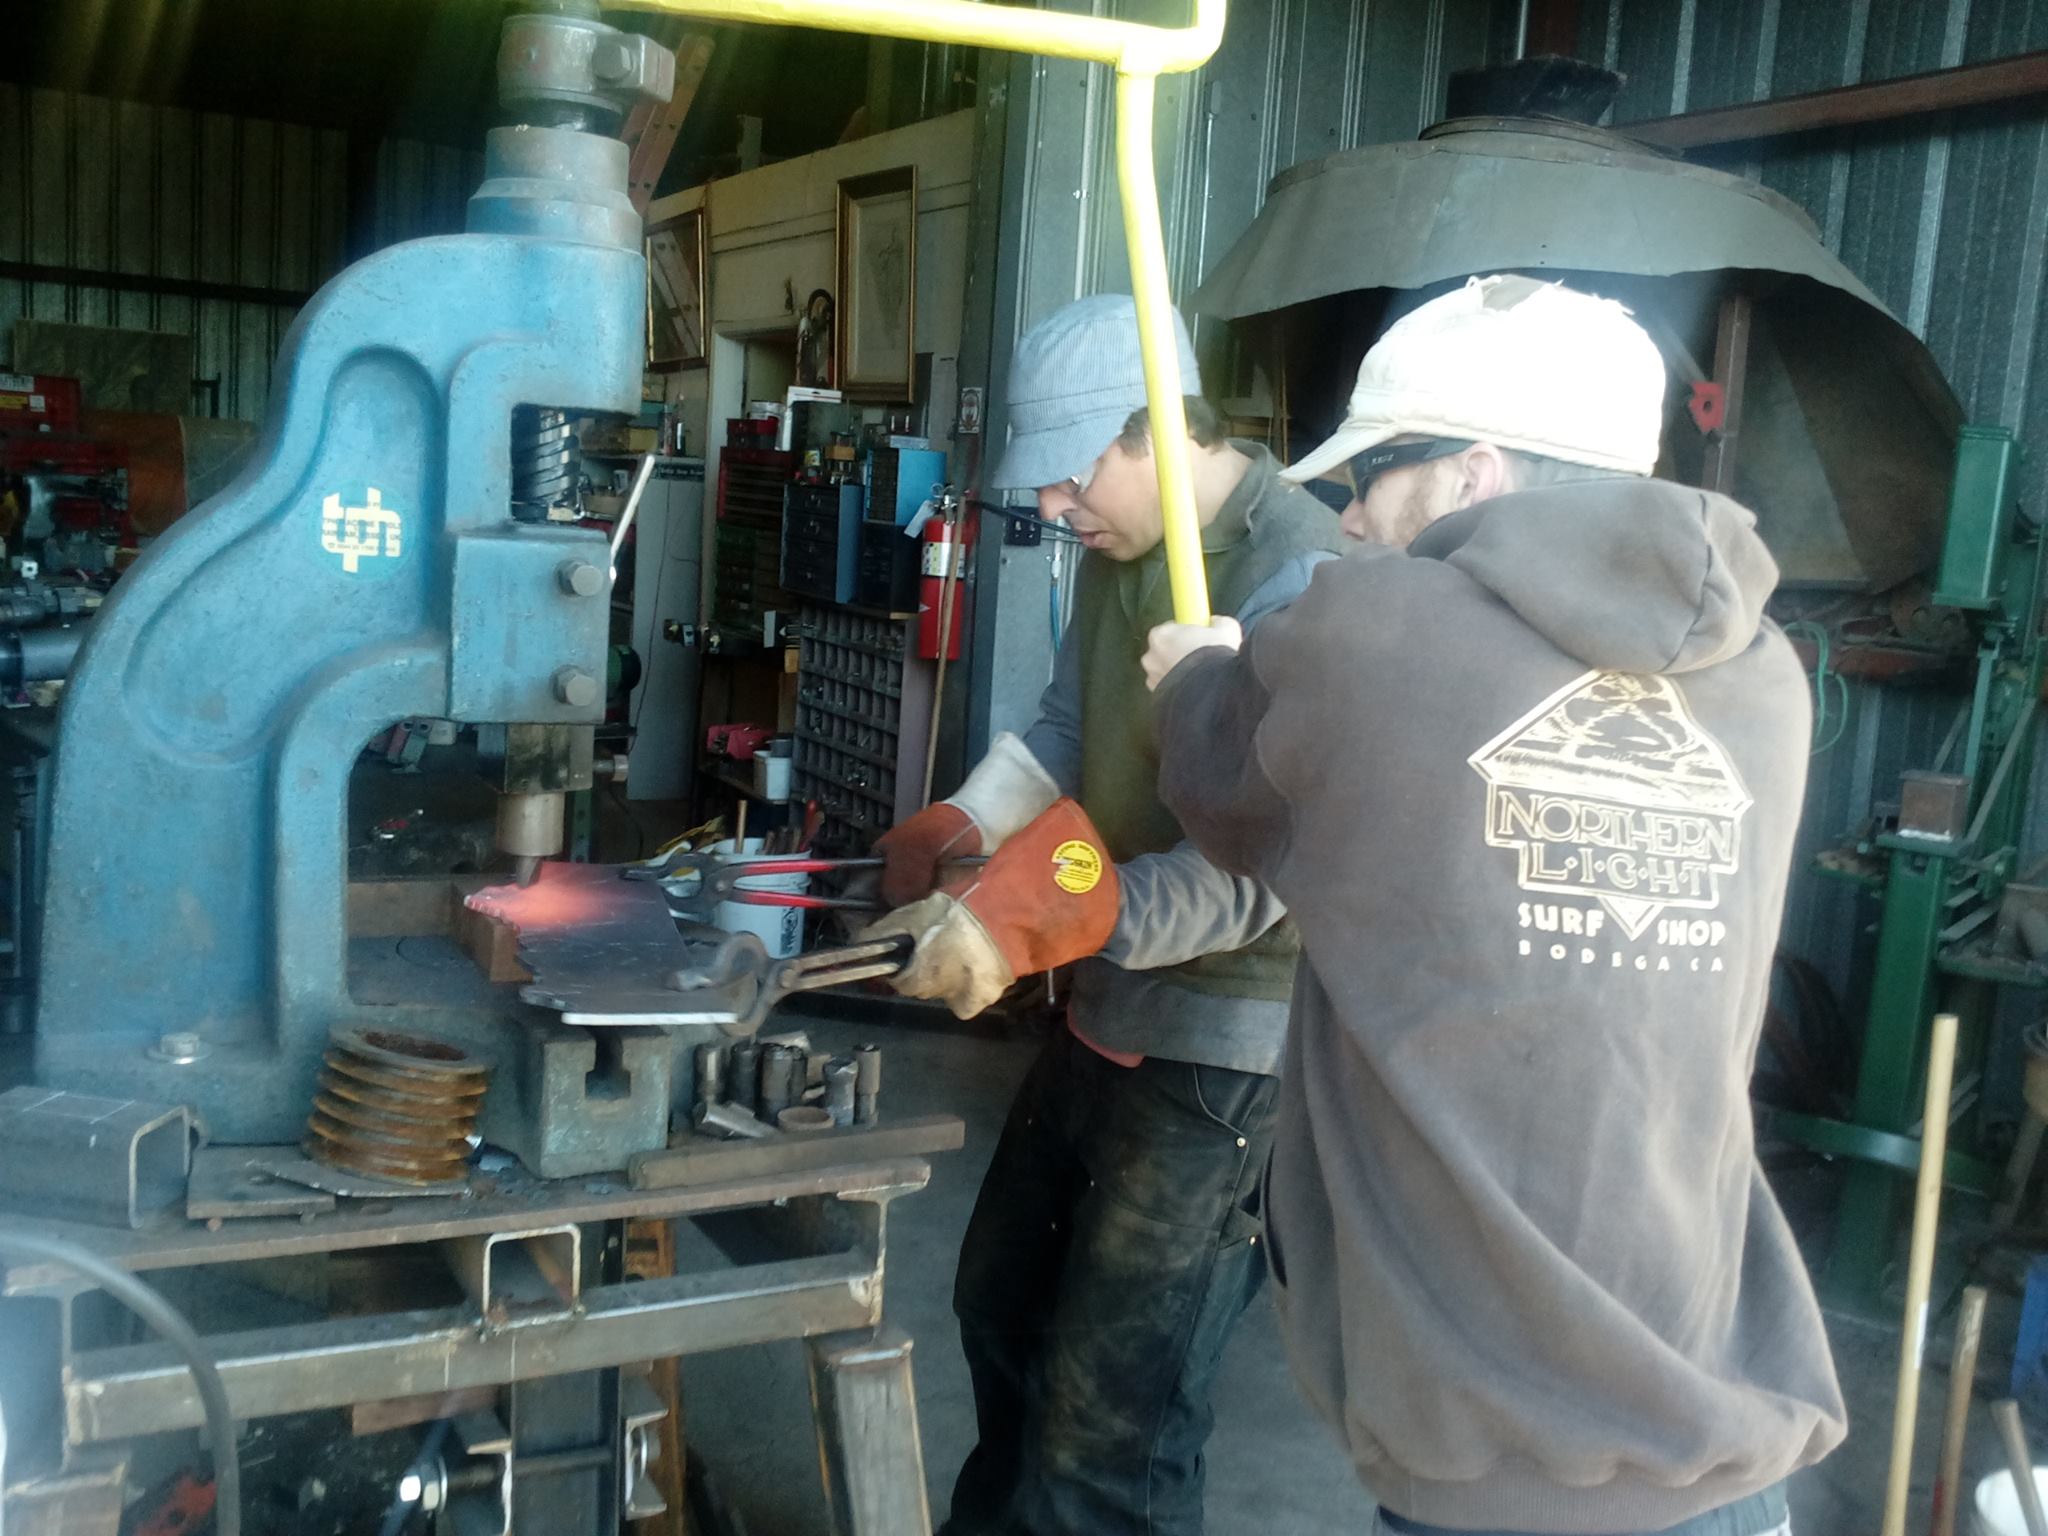
We also have a separate business that does metal fabrication and sculpture work. We are working on integrating more of the metalwork into our mapping, and vice-versa. Here is a new project that uses texturing dies in an eight-ton fly press to create map-based artworks.
Past and Ongoing Mapping Projects
Big Chico Creek Forest Management Plan – 2020
DCR provided fire behavior and prescribed burning specialists for planning and design of a 1,500-acre fuels reduction and forest health project in the Big Chico Creek Watershed, near Forest Ranch, Ca. This project is a collaboration between Butte County Fire Safe Council, CSUC’s Big Chico Creek Ecological Reserve, and several local landowners. This CEQA document will support partial implementation of a Forest Management Plan, also to be developed by BCRCD, covering 7,500 acres of the watershed. DCR mapped wildfire fuel loading conditions and developed large prescribed burning units in ponderosa pine and black oak forest areas.
Oroville Dam Spillway Response – Ongoing
Client: California Department of Water Resources
DCR has been providing rapid-assessment mapping on the Oroville Dam project site since the Spillway emergency began in February 2017. We have created maps for the original emergency response teams, and have been supporting geological surveys of the bedrock beneath the spillway. Field geologists bring their field data to us, and a DCR geologist and mapping experts turn their field notes and hand-drawn maps into a high-resolution mapping dataset.
Klamath River Prescribed Fire Training Exchange (TREX) – Ongoing since 2014
Client: Mid-Klamath Watershed Council
We are part of the core team organizing and executing annual prescribed fire projects in the Klamath Mountains. We help provide participants and communities along the Klamath River with experience and training on how to plan and implement controlled burns, protect communities from wildfires, and prepare for managing wildfires for resource benefits.
Providing aerial observations during a prescribed burn in the Klamath Mountains (more footage here).
Western Klamath Restoration Partnership – 2015-2016
Client: Mid Klamath Watershed Council
This project used airborne LiDAR data to characterize forest canopy structure for about 25,000 acres in the Klamath Mountains near Somes Bar, California. This mapping will be used to design thinning and prescribed burning projects to improve community and firefighter safety across this fire-prone part of the planet.
Upper Feather River Watershed Integrated Regional Water Management Plan
Client: Plumas County and Uma Hinman Consulting
We provided mapping and website design to support a major planning project to establish priorities for water management-related projects across the watershed that provides 75% of the water used by the California State Water Project. One of our major tasks on this project was the design of a map-based document library.
Integrating Traditional Ecological Knowledge into Community Wildfire Protection Planning – 2014
Client: Orleans/Somes Bar and Happy Camp Fire Safe Councils
We facilitated collaborative mapping efforts with agency staff, Karuk and Yurok tribal members, and community practitioners of forestry. These meetings identified areas where large-scale cultural burning projects could improve acorn production, open up traditional travel routes, improve elk habitat, and protect communities along the Klamath. In addition, we participated in the 2014 Klamath River ‘TREX’ community-based prescribed burning training, filling mapping support, ignition, and firefighting roles.
Petroleum Pipeline Right-Of-Way Survey Tool and Data Management Workflow – 2014
Client: Kinder Morgan Co.
Developed a tablet-based mapping workflow and data management system to rapidly assess conditions along a major interstate gas pipeline.
McNabney Marsh Vegetation Mapping Project – 2014 and 2001
Client: Mountain View Sanitation District
Used current Infrared aerial photography and field botany data to create a vegetation map for a 200-acre marsh in Martinez, CA. Conducted accuracy assessments, rectified aerial imagery to map-scale, and authored a discussion for the final report.
Document Library and Data Management for the CABY and Upper Pit River IRWM Projects – 2011-2012
Client: Sacramento River Watershed Program
Westwood Millsite Reuse Survey – 2011
Client: Mountain Meadows Conservancy
Used 1941 and current aerial photography to design a poster showing the locations of buildings and facilities at the historic Westwood, CA, Mill Site, and current conditions. This work and our aerial photography accompanied a report that developed strategies to remediate potential pollution at the site, and convert the property to a more beneficial use.
Butte Creek Aerial Atlas
Client: Friends of Butte Creek
Captured and geotagged aerial photographs showing landscape and infrastructure features along Lower Butte Creek, in California’s Sacramento Valley.
